Table of Contents
Investing in property can feel like diving into a pool without knowing how deep it is. Will you hit gold at the bottom or smack into concrete? The secret to success isn’t luck—it’s using data to make smart, informed decisions.
This step-by-step guide will show you how to pick the right property by using powerful tools like Boomscore Suburb Profile and performing detailed cash flow and capital growth analyses. Whether you’re after steady rental income or long-term wealth, you’ll learn how to crunch the numbers like a pro.
Part 1: The Hunt for the Perfect Suburb
Every great investment starts with a location, and not all suburbs are created equal. So how do you find the next hotspot before it’s plastered all over the news? Easy—use Boomscore Suburb Profile.
Why Boomscore Is a Game-Changer
Think of Boomscore as your real estate crystal ball. It ranks suburbs based on metrics like demand, growth potential, infrastructure, and more. It saves you from spending hours sifting through random data and gives you clear insights at a glance.
Here’s what Boomscore focuses on:
- Growth Trends: Suburbs with upward trends in prices and development.
- Vacancy Rates: Areas where tenants are desperate to move in.
- Infrastructure Projects: Nothing makes property values skyrocket like a new train line or shopping centre.
How to Use Boomscore Like a Pro
- Search for a Suburb: Let’s say you type in “Ellenbrook.” Boomscore pulls up stats on median house prices, rental yields, vacancy rates, and even infrastructure plans.
- Rank Suburbs by Your Goals:
- If you want capital growth, look for suburbs with high growth scores and big-ticket infrastructure projects.
- If you’re after rental income, focus on vacancy rates (less than 2% is ideal) and strong rental yields.
- Compare Scores: A suburb with a growth score above 70 and a vacancy rate below 2% is usually a winner.
Real-World Example: Ellenbrook, WA
Let’s put Ellenbrook under the microscope:
- Median House Price: $450,000
- Vacancy Rate: <1% (good luck finding an empty rental!)
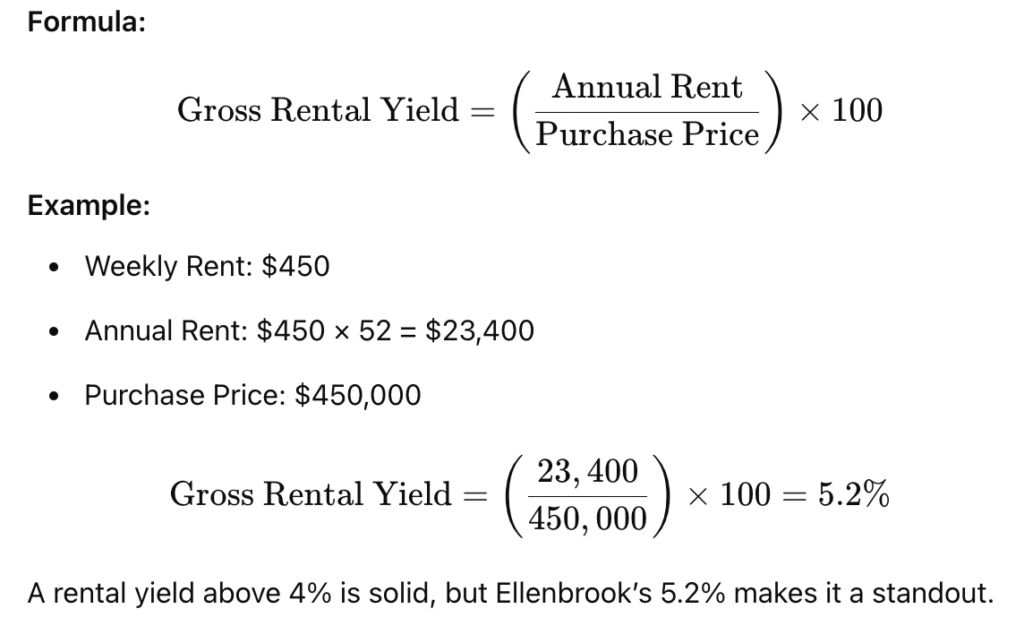
- Rental Yield: 5.2%
- X-Factor: The new train line via Metronet makes Ellenbrook more connected than ever.
Verdict? Ellenbrook looks promising for both rental income and long-term growth. But finding a suburb is just the first step—next, you need to run the numbers.
Part 2: Crunching the Numbers Like a Property Guru
Once you’ve found your suburb, the real work begins. Let’s take a specific property in Ellenbrook and figure out if it’s a smart investment. Spoiler alert: the math is easier than you think.
1. Calculate Rental Yield
This is your starting point. Rental yield tells you how much income the property generates compared to its price.
2. Analyze Vacancy Rates
Vacancy rates tell you whether tenants are queuing up for properties or if they’re ghosting your rental ads. A rate below 2% is ideal, and Ellenbrook’s <1% is like striking gold. You’re almost guaranteed consistent rental income.
Pro Tip: You can find vacancy rates on Boomscore or SQM Research for free.
3. Do a Cash Flow Analysis
Here’s where you find out if the property puts money in your pocket or bleeds you dry.
Step-by-Step:
- Add Up Annual Expenses:
- Council Rates: $2,000
- Insurance: $1,500
- Property Management Fees: $1,638 (7% of rent)
- Maintenance: $1,000
- Calculate Loan Repayments:
- Loan Amount: $360,000 (assuming a 20% deposit of $90,000)
- Interest Rate: 7%
- Annual Interest Payment: $360,000 × 0.07 = $25,200

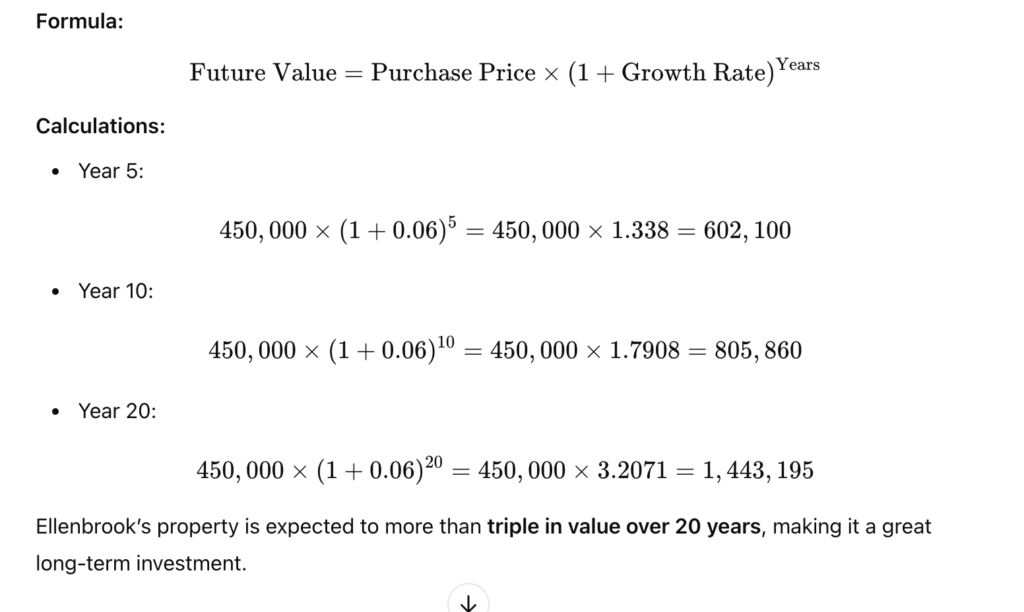
4. Project Capital Growth
Now let’s see if the property’s value will make up for the negative cash flow over time.
The Final Verdict
Let’s sum it up:
| Metric | Result |
|---|---|
| Purchase Price | $450,000 |
| Gross Rental Yield | 5.2% |
| Vacancy Rate | <1% |
| Net Cash Flow (Year 1) | -$8,738 |
| Capital Growth (20 Years) | +$993,195 (Value: $1,443,195) |
Key Takeaways:
- The property has negative cash flow in the short term, so you’ll need to cover the gap.
- However, its strong capital growth potential makes it a great choice for long-term wealth building.
- Ellenbrook’s low vacancy rate and future infrastructure projects reduce risks.
Advanced Metrics Analysis: Taking Property Investment to the Next Level
Once you’ve nailed the basics of rental yield, cash flow, and capital growth, it’s time to level up your analysis with advanced metrics. These insights help investors gain a deeper understanding of a property’s performance, risk factors, and long-term viability. Let’s dive into the more complex (but vital) metrics that savvy investors swear by.
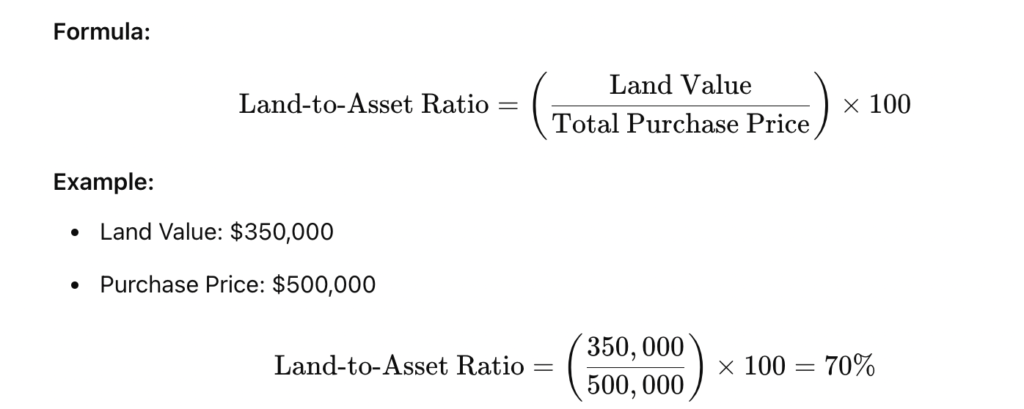
1. Land-to-Asset Ratio: Why It Matters
The land-to-asset ratio is a critical metric for understanding how much of your investment is tied to the land versus the building. In Australia, land appreciates over time, while buildings tend to depreciate due to wear and tear. A high land-to-asset ratio generally indicates a property with strong growth potential.
Why It’s Important:
- Properties with a higher land-to-asset ratio (60–70%) tend to perform better regarding capital growth.
- Low ratios (<50%) might indicate a property where the majority of value is in the building, which could depreciate over time.
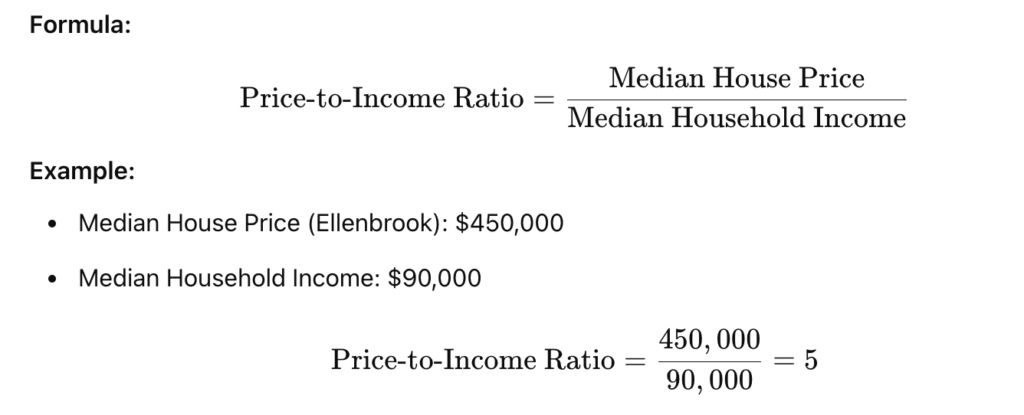
2. Price-to-Income Ratio (Affordability Index)
The price-to-income ratio measures how affordable a suburb or property is relative to local income levels. This is especially useful for predicting future demand and buyer behaviour.
Interpretation:
- Ratios above 6 may indicate affordability issues, potentially limiting future buyer demand.
- Ratios below 4 suggest properties are more affordable, which often drives demand and growth.
3. Demand-to-Supply Ratio (DSR)
The DSR gauges how competitive the property market is in a particular area. It measures the balance (or imbalance) between buyer demand and available supply.
How to Read DSR:
- Scores between 70–100: High demand, low supply (great for investors).
- Scores below 50: Low demand or oversupply (risk of stagnation).
Tools to Find DSR:
Boomscore and SQM Research are excellent for accessing DSR insights for Australian suburbs.
4. Rental Affordability Index (RAI)
Rental affordability is a critical factor for buy-to-let investors. It measures how much of an average tenant’s income is spent on rent. The RAI provides clues about the sustainability of rental demand in a suburb.

Benchmark:
- Below 30%: Rent is considered affordable.
- Above 30%: Rent might become unsustainable for tenants, leading to higher vacancy rates.
5. Loan-to-Value Ratio (LVR)
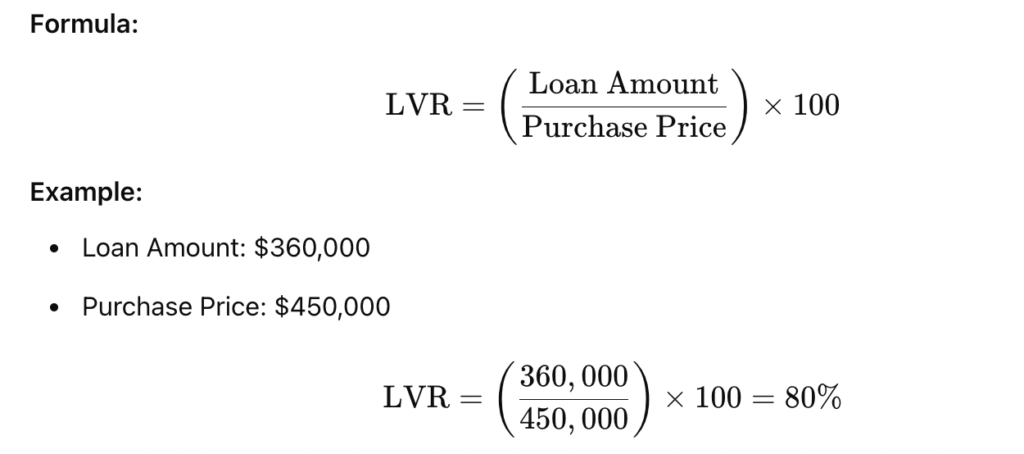
LVR measures how much of the property purchase price is financed through borrowing. A lower LVR reduces risk and can improve cash flow, but it also means a higher upfront investment.
Why It’s Important:
- Lenders often require LMI (Lenders Mortgage Insurance) for LVRs above 80%.
- A lower LVR provides a buffer against market downturns.
6. Time on Market (TOM)
Time on the Market measures how quickly properties in a suburb are being sold. A short TOM suggests high demand, while a long TOM may indicate a lack of buyer interest.
Tools for TOM:
- Boomscore and CoreLogic provide reliable TOM data.
- Suburbs with a TOM under 30 days are typically in high demand.
7. Break-Even Point
The break-even point estimates how long it will take for the property to stop being cash flow negative and start generating profits.
How to Calculate:
- Add up initial and ongoing expenses.
- Divide this by annual rental income minus expenses.

Practical Application: Ellenbrook Advanced Metrics
Let’s revisit Ellenbrook with these advanced metrics in mind:
| Metric | Result | Insight |
|---|---|---|
| Land-to-Asset Ratio | 70% | High growth potential due to strong land value. |
| Price-to-Income Ratio | 5 | Affordable compared to Perth averages. |
| Demand-to-Supply Ratio | 75 | High demand with limited supply—ideal for growth. |
| Rental Affordability Index | 26% | Sustainable rental demand in the area. |
| Loan-to-Value Ratio | 80% | Balanced, avoids LMI fees. |
| Time on Market | 28 days | High buyer interest, strong demand. |
| Break-Even Point | ~4 years | Manageable short-term cash flow gap. |
How Advanced Metrics Transform Your Investment Strategy
Advanced metrics aren’t just numbers—they’re your guide to making smarter decisions. They help you:
- Reduce Risk: Spot potential red flags before you buy.
- Plan Long-Term: Understand when your investment will become profitable.
- Maximize ROI: Focus on areas and properties with the best growth and income potential.
By layering these insights on top of your basic calculations, you can identify properties that meet your goals and outperform over time.
Final Thoughts: Combining Data and Strategy
Successful property investing is about more than gut feelings or following trends. It’s about using data to your advantage. Tools like Boomscore, CoreLogic, and SQM Research provide the insights, but it’s up to you to apply them strategically.
With advanced metrics in hand, you’ll understand what to buy and why it’s a good deal. That’s how you turn a property into a profitable long-term asset.
Disclaimer: The information provided on this blog is for general informational purposes only and is not intended to be financial advice. The content is not a substitute for professional financial advice, diagnosis, or treatment. Always seek the advice of your financial advisor or other qualified financial service provider with any questions you may have regarding your personal finances. Reliance on any information provided by this blog is solely at your own risk.


Leave a Reply